We spent three months looking closely at twenty independent beauty brands selling DTC — brands with annual e-commerce revenue between $2M and $45M, most on Shopify Plus, covering skincare, color cosmetics, and hybrid categories. We weren't looking at brand equity or marketing spend. We were looking at digital experience decisions: how each brand structured its product pages, what tools it used to support shade selection, how its checkout flow handled uncertainty, and what post-purchase experience it offered. The patterns that separated the brands with the lowest return rates and highest repeat purchase rates from the rest were surprisingly consistent.
Methodology and Sample Composition
The twenty brands in this analysis were selected to cover a range of category focus, price point, and founding year. We excluded brands with dedicated AR engineering teams (three of our initial candidates fell into this category and were removed). We also excluded brands with active wholesale distribution above 30% of revenue, since wholesale dynamics introduce too many confounding variables into e-commerce performance comparisons.
We segmented the sample into two groups: the top-third by a composite metric combining return rate, repeat purchase rate at 90 days, and product-detail page conversion rate — and the bottom-third by the same metric. The middle cluster (roughly seven brands) was excluded from the primary comparison to sharpen the contrast between strong and weak performers. Return rate data came from self-reported brand figures during interview sessions; conversion and repeat purchase data was drawn from Shopify analytics exports with consent. All brands in this analysis remain anonymous by agreement.
Finding 1: High-Performers Invest Heavily in Shade Confidence Tools
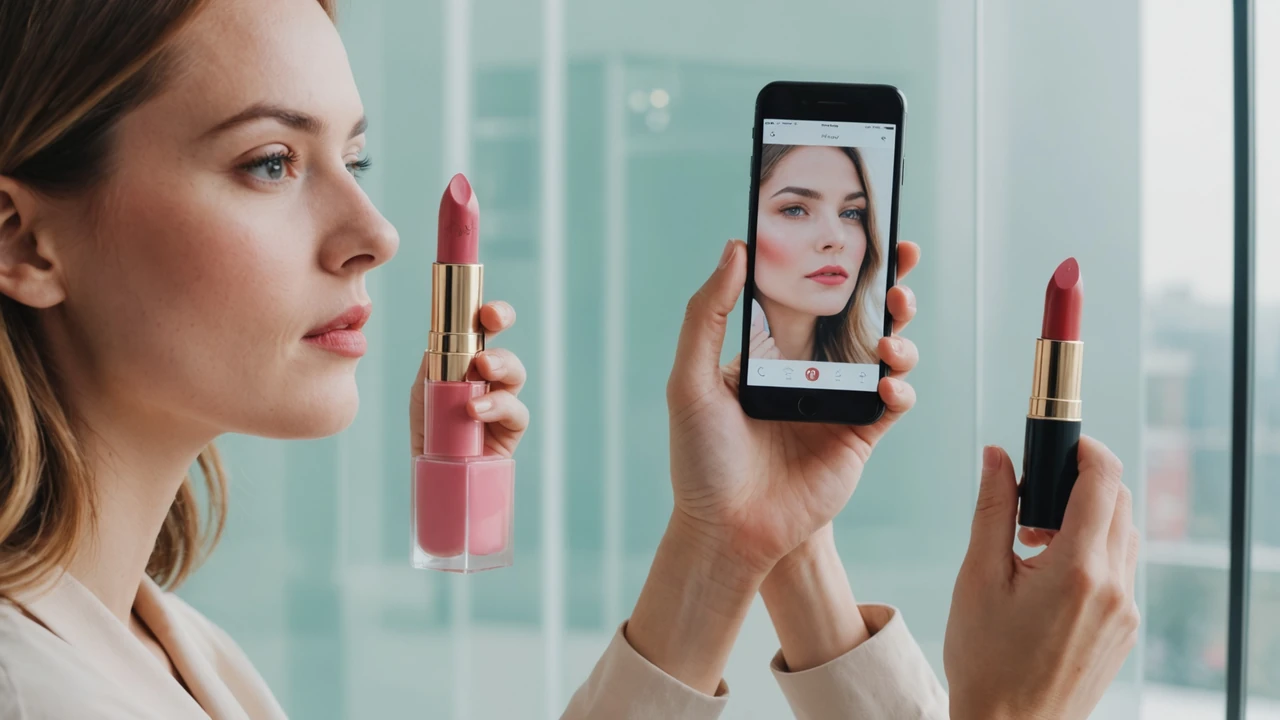
Every top-performing brand in this analysis had at least one shade-confidence mechanism on their product detail pages — a tool, feature, or content format designed specifically to reduce shade uncertainty at the point of decision. The specific implementation varied: two brands used live AR try-on, four used shade-finder quizzes, three used user-generated content filtered by skin tone, and two used detailed undertone guides with model photography across Fitzpatrick I–VI.
What mattered wasn't the specific tool. It was the presence of something. Among bottom-third performers, only one brand had any dedicated shade-confidence mechanism — and that brand's implementation was a static comparison image that was two product generations out of date.
The average product-detail page conversion rate among top-performing brands in our sample was 4.3%, compared to 1.9% among bottom performers — a 2.4-percentage-point gap that, at median order values around $42, represents substantial revenue per thousand sessions. Shade-confidence tools aren't the only variable behind this gap, but the correlation is consistent across the sample.
Finding 2: Return Rates Split Sharply on Shade Communication Quality
The average return rate across our full sample for color cosmetics was 28%. Among top-performing brands, the average was 14%. Among bottom performers, it was 41%. That spread — 27 percentage points between the high and low groups — is primarily driven by shade-mismatch returns. When we asked brand teams to characterize the most common return reason from their customer communications, every bottom-third brand cited some version of "didn't look like I expected" or "wrong shade for my skin tone." None of the top-third brands listed shade mismatch as their top return driver.
Shade communication quality, in practice, means three things: accurate product photography (not oversaturated or filtered), honest shade descriptions that tell a shopper what they're actually getting (undertone, intensity, finish), and a mechanism for seeing the shade in relation to their own appearance. Brands that got all three right consistently outperformed those that handled only one or two.
A return rate difference of 27 percentage points between high and low performers in a $15M annual revenue brand translates to roughly $2.1M in logistics and lost-margin exposure annually. Shade communication isn't a nice-to-have. It's a cost-of-business variable.
Finding 3: Top-Performing Brands Treat Mobile PDP as the Primary Design Surface
When we audited each brand's product detail pages, we measured five mobile-specific factors: time to first meaningful content, above-the-fold product image quality, shade selector usability on a 375px screen, primary CTA placement, and try-on or shade-aid tool accessibility without scrolling. Top performers scored substantially better on every metric. The clearest gap was in shade selector usability — most bottom-performing brands had shade selectors built for desktop interaction that were functionally difficult to operate on a phone screen, requiring pinch precision on 8px color swatches.
This matters because 71% of beauty DTC sessions in our sample occurred on mobile, based on Shopify analytics data. Building for desktop first and hoping mobile renders acceptably is not a viable strategy when seven in ten shoppers are on their phones.
| Digital Experience Factor | Top Third (avg score) | Bottom Third (avg score) |
|---|---|---|
| Shade confidence mechanism present | 100% of brands | 14% of brands |
| Mobile PDP above-fold CTA accessible | 86% of brands | 29% of brands |
| Undertone described in shade copy | 86% of brands | 43% of brands |
| Shade selector usable on 375px screen | 71% of brands | 14% of brands |
| Post-purchase "shade match" follow-up | 57% of brands | 0% of brands |
Finding 4: Post-Purchase Engagement Compounds Repeat Purchase Rates
One of the more surprising findings was around post-purchase shade engagement. Four of the seven top-performing brands sent a post-purchase email or in-account prompt at the 10–14 day mark asking customers to rate their shade match. This wasn't primarily a review-solicitation strategy — it was framed as a shade satisfaction check-in, with a direct path to exchange or credit if the shade hadn't worked as expected.
The brands doing this reported two benefits: a measurable reduction in chargebacks and disputes (since customers with shade issues had a clear channel to resolve them before initiating a return), and higher 90-day repeat purchase rates. Our data suggests the repeat purchase rate advantage was around 11 percentage points for brands with a shade-match follow-up sequence versus those without one. The theory is straightforward: a customer who feels confident their shade issue will be resolved without friction is more likely to come back and try another shade, rather than writing off the brand.
What These Brands Did Not Do
It's worth noting what the top-performing brands in this sample did not do. None of them had more SKUs than bottom performers — the median catalog size was similar across both groups (around 85 active SKUs). None of them were spending dramatically more on paid acquisition. None of them had significantly faster site load times.
The differentiation was almost entirely in digital experience decisions: how shade information was presented, what tools were available to reduce purchase uncertainty, how mobile interactions were handled, and how post-purchase concerns were addressed. These are choices, not capabilities that require large engineering resources or substantial capital. A mid-size DTC beauty brand on Shopify Plus can implement all of the practices we observed in top performers without custom development work.
In our view, the gap between strong and weak DTC beauty brand performance is narrowing the opportunity for brands willing to focus on experience fundamentals rather than acquisition spend. The market is not won on the basis of who runs the most ad impressions. It's increasingly won on the basis of who makes shoppers confident enough to buy — and satisfied enough to come back.