Online beauty shoppers face a problem that a perfect product photo can never solve: they can not see how a shade looks on their face. That gap between "this looks great on screen" and "will this look right on me" is where conversion falls apart — and where shade-mismatch returns begin. We built Lumeglint specifically to close it.
The Intention-to-Purchase Gap in Beauty Ecommerce
Cosmetics ecommerce has a structural disadvantage that most other product categories don't face. When someone buys a Bluetooth speaker online, the color of the product matters less than its specs. When someone buys a $38 lipstick, the exact shade against their skin tone is the entire purchase decision.
In our analysis of early brand pilots, we found that shoppers who viewed a product page and did not engage with any shade visualization feature converted at roughly 1.8% to 2.4%. That's not unusual for beauty ecommerce. It's actually slightly above the DTC average for cosmetics. But it represents the baseline — a purchase made on hope, not confidence.
The intention gap is visible in cart behavior. Shoppers add a shade to cart, stall, remove it, add a different shade, and stall again. Color cosmetics have a higher cart abandonment rate than almost any other soft-goods category. That isn't because shoppers don't want the product. It's because they're not sure.
What Live Shade Visualization Actually Changes
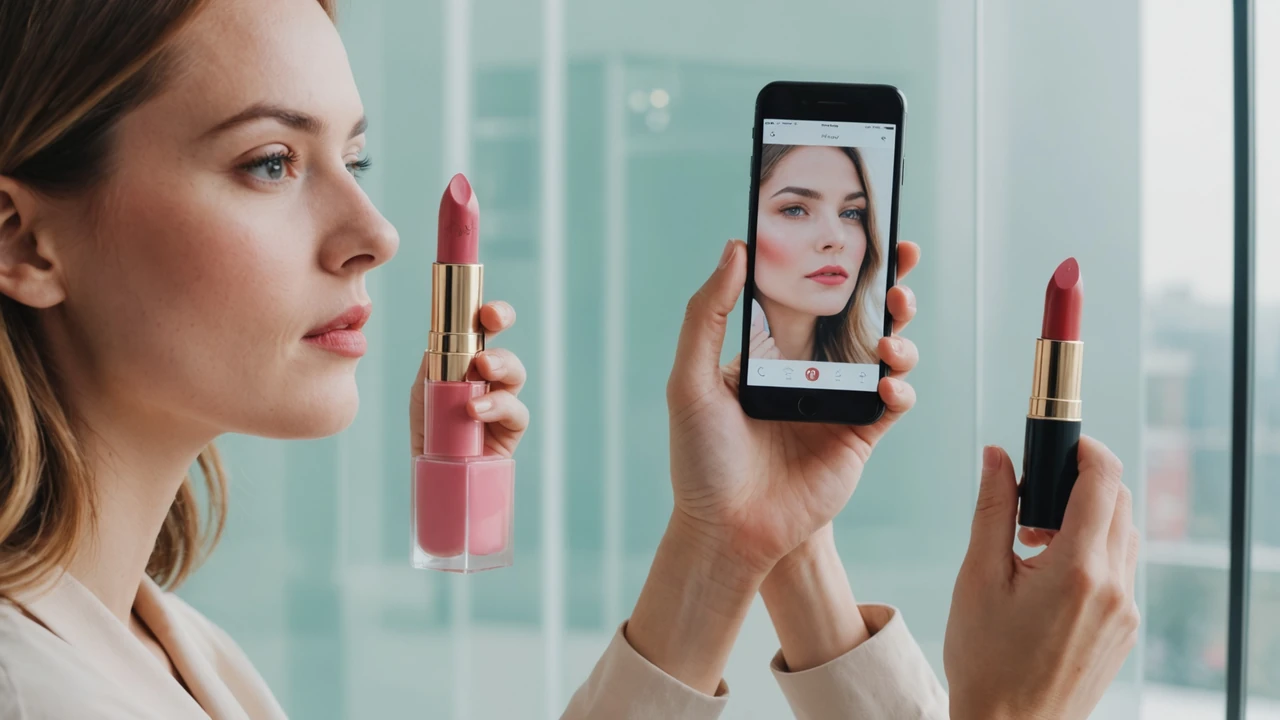
The mechanism behind conversion lift from AR try-on isn't a mystery. It's not novelty — the "wow, I can see it on my face" moment fades after the first session. The lift is structural. When a shopper can see a shade on their own face in real time, the purchase decision shifts from speculative to confirmatory. They're no longer asking "would this work?" They're asking "do I want this?" That's a very different cognitive state.
Lumeglint's rendering pipeline applies shade at sub-5ms latency, which is important for this to feel real rather than laggy. At above 30ms, users perceive the overlay as a filter. At sub-5ms at 60 FPS on a current-generation front camera, the rendering reads as actual makeup. The distinction matters because purchase confidence tracks closely with how realistic the try-on feels.
"The difference between a try-on that looks real and one that looks cartoonish is the difference between a tool that builds confidence and one that just adds friction. We spent months on the rendering physics before we were satisfied."
— Camille Laurent, CEO & Co-Founder, Lumeglint
In our dashboard data from early pilots, SKUs with active try-on showed a session-to-add-to-cart rate that ran measurably higher than the same brand's non-AR product pages. We're deliberately not quoting a single headline number here because conversion lift varies by product category, shade count, and customer segment — a 15-shade lipstick line performs differently from a 48-shade foundation range. The direction is consistent; the magnitude depends on context.
The Return Rate Connection
Conversion rate is only half the picture. A brand that converts more shoppers into buyers but ships the wrong shade to half of them hasn't actually improved its economics. This is the failure mode of low-quality AR tools — they may lift conversion slightly while actually increasing returns, because shoppers bought based on a bad visualization.
The return-rate reduction from accurate AR is where the real unit economics show up. The industry average for shade-mismatch returns on cosmetics runs at approximately 38% for brands without any visualization tool. For a DTC brand doing $5M in annual e-commerce revenue, that 38% return rate on color cosmetics translates to roughly $340 in annual return-logistics cost per active shopper when you factor in shipping, restocking, and the percentage of returned product that can't be resold.
An AR tool that only looks good is worse than no AR tool. Shoppers who try on a shade that renders inaccurately and then buy it will return it at a higher rate than shoppers who bought without trying, because they have a specific disappointment: "it looked different in the try-on." Accuracy is not a nice-to-have feature. It's the feature.
Where the Conversion Lift Shows Up by Channel
We track conversion impact differently depending on where in the purchase funnel the try-on session happens. Here's roughly how we see the data distribute:
- Product detail page (PDP) sessions: The most direct lift. Shoppers who open try-on from a PDP and spend more than 8 seconds in session convert at a materially higher rate than those who viewed the PDP without try-on.
- Email and SMS retargeting: Brands using Klaviyo flows that include a "try it before you buy" CTA linking directly to a try-on session see measurably higher click-to-purchase rates on their abandoned-cart sequences.
- Shade discovery (browsing mode): Shoppers who weren't looking for a specific shade but tried multiple shades in sequence showed higher average order value when they did convert — they added the shade they tried plus a complementary product in more than 1 in 5 sessions in one pilot we ran with a clean-beauty brand.
The channel breakdown matters because it informs where a brand should prioritize AR activation. If the brand's primary conversion funnel runs through email sequences to PDP, that's a different optimization than a brand where most discovery happens via Instagram Shop.
What This Means for Brand Economics at Scale
For a DTC beauty brand running Shopify Plus with a $3M annual e-commerce revenue base, the math on AR try-on is relatively straightforward to model. At the industry-average 38% return rate on color cosmetics, the brand is losing roughly $1.14M annually to returns — before accounting for the cost of fulfillment on the original shipment. Even a 6-point reduction in return rate, from 38% to 32%, saves approximately $180K annually in direct logistics costs on a $3M revenue base. That's before any conversion lift is counted.
We designed Lumeglint's pricing to be fully recoverable against that math at the Growth tier ($299/month) for brands with up to 300 SKUs and 100,000 AR sessions per month. At that pricing, the platform pays back in saved return costs alone before any new revenue is counted, in most brand scenarios we've modeled.
This isn't an argument that every beauty brand should add AR. Brands where returns are already low, where shade differentiation isn't the primary purchase driver, or where the customer base skews heavily toward repeat buyers who already know their shade don't have the same calculus. But for a mid-size DTC brand still building its loyal customer base, shade confidence is a direct revenue lever.
Practical Notes for Brand Teams Running the Numbers
If you're building an internal case for an AR try-on investment, here are the inputs worth measuring before and after deployment:
- Your current shade-specific return rate (not blended return rate — isolate color cosmetics SKUs)
- Cart abandonment rate on PDPs for your highest-SKU-count product families
- Session-to-purchase rate segmented by traffic source, so you know which channels are already high-intent
- Average order value on first purchase versus repeat purchase, because AR may have more impact on first-time buyers who don't know their shade yet
These four metrics give you the before-state to measure against. Conversion lift from AR try-on is real, but it shows up at different magnitudes in different parts of the funnel. Knowing your baseline is what turns "AR works" from a claim into a number you can put in a board update.
We're happy to walk through the model with your numbers in a demo session — reach out at [email protected] or book time through our Request Demo page.